
Mac OS X Grapher: A quick guide
The "Grapher" computer program is part of Mac OS X. These instructions give you an introduction to the program. With "Grapher" graphs can be displayed differently.
Display graphs on the Mac - with Grapher
- Click on the Finder and type "Grapher" in the search field. Open the program found.
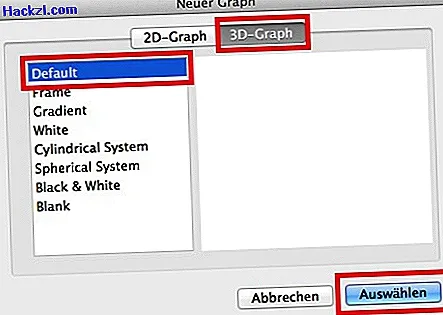
- You can choose between 2D and 3D graphs. Under "3D-Graph" click on "Default" and then on "Select".
- Enter the function to be displayed in the field next to "z =". Tap the Enter key or click the equation on the left to view it. In our picture gallery you can see a sample graph.
- The information window opens. In this you can make some visual changes. For example, change the "colors" or have "contours" and "shadows" shown. You can use it to create attractive 3D graphs.
- If you want to write a new equation, click on the "+" at the bottom left. There choose "New Equation". In this way you can display several graphs in one display and create 3D landscapes.
- In the upper task bar you can "enlarge" or "reduce" the graph. If necessary, you can use the "Center origin" or "Align axes" buttons.
- With the "+" you can also add rows of points and display interpolation functions.
In another practical tip, we will explain how to edit images with iPhoto.
Latest videos
Start the program by choosing the desired system.
Enter your function and create a 3D graph. Several display options are available in the information window.

Additional equations can be added using the small "+" at the bottom left of the work area.

Graph several equations in one room.

You can use the taskbar to zoom into the room, for example.

You can also display rows of points in the room.
