
Insert trend line in Excel - Here's how
To make the development in an Excel diagram clear, you can insert a so-called "trend line". That sounds difficult - but it is not at all: We will show you how you can show the trend simply and cleanly.
How to insert a trend line in Excel
- Create your diagram in Microsoft Office Excel as usual. To show a development, column and line diagrams are recommended.
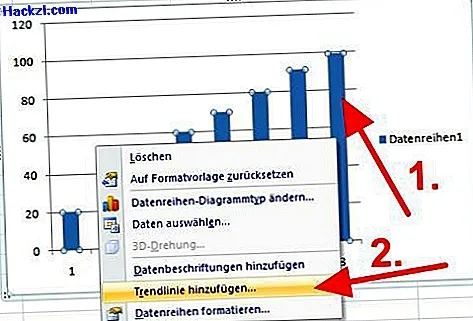
- Right-click on one of the columns. Now a context menu is displayed, which contains the point "Add trend line". You have to select this (see picture).
- In the last step, Excel prompts you to format the trend line: in addition to the line color, you can also determine the regression type yourself. The selection ranges from linear regression to a polynomial and exponential function.
- You have to select the respective regression type according to the data history. If you are not sure, small preview pictures will help you. In addition, the currently selected type is applied at the same time, so that you can see whether the line fits before "OK".
You can find more tips and tricks for Excel here.